I have been looking for a tool (or tools) for quite a while that help me do my job. My job is a Principal Product Manager focused on strategy in the tech space. Generally I am thinking on a 3-5 year horizon, although at times less or more. What does this really mean? I try to look at myself as someone who can distill down the plethora of data out there into usable information for the teams I work closely with. I like to think in terms of “what can I provide to help other teams make more informed decisions”.
Why do I need a tool to help me with this?
Gathering data to make decisions can be a cumbersome process. as you gather more data over time it becomes increasingly harder to take advantage of that data, or to find connections you care about.
When I am looking through old research, I want to find the nuggets that I thought were interesting days, weeks, or even months ago. I want to understand the context of that data and what decisions I may be able to make from them.
The way I capture data has been in the form of Observations, Insights, and Opportunities. I tend to look at these across the landscape horizons of Customers, Markets, and Technology.
Observation: What is happening. This is something that you observe either directly, or indirectly through some other means. (like reading secondary research). This just captures the thing you find interesting on a topic that has been observed.
Insight: Why is this happening. Insights take our own knowledge and critical thinking to understand the why behind the observation. This requires our own personal experiences, expertise in a space, understanding of other observations, and general understanding of the space.
Opportunity (or hypothesis): Once you have gathered many similar observations or insights, you might start to apply some critical thinking and generate an opportunity. Sometimes these are distinct opportunities, sometimes they are a hypothesis you want to be able to validate.
Example
- OBSERVATION: The average person binged four shows in the past two months, with Americans 18–24 and 25–34 binging five shows in that same time frame.
- INSIGHT: Many people binge watch during prime time watching hours. This can put a strain on a network, which would lead to a poor product experience.
- PRODUCT OPPORTUNITY: Use knowledge of the streaming happening on a network or service to recognize when binge watching is occurring. The service could pre-fetch the next few episodes over night when network traffic is low, store these episodes on a gateway or caching device. When the user wants to watch these shows, they transparently come from the gateway on the edge, and not the cloud. This will save network traffic and make for a better experience for the user.
What have I tried, and why did it fail?
I have tried a few different tools over the years. Some stick more than others, but non have been the end-all/be-all solution I was looking for. I will try to be brief, but here are a couple of examples.
Excel
I tried to track these items in Excel. I would create the columns and categorizations I needed and place text in the cells. If I had an observation I wanted to capture, I usually copy/pasted into my excel, cited the source, and categorized. It was tedious, but somewhat structured.
Why did it fail?
I think it came down to how Excel handles text mainly. It is not great for large blobs. It also made it hard for me to track links between items.
Evernote
Evernote was great at note taking, but it never really worked for me in this capacity. I was able to find documents with certain tags, but the nuggets I cared about were not easily surfaced.
Roam
Roam was the first big eye opener for me for something along the lines of the PKM space. knowing I could have my own solution was great. Backlinks were helpful in referencing items and surfacing topics. The QUERY functionality was the best in Roam. It made it relatively easy to find things.
Why did it fail?
Lack of structured data was probably the biggest failure for me. But, like many, I did not like the direction Roam was heading. Before sinking too much data into the system, I decided to move on to something else.
Obsidian
Keeping this one short. Obsidian was similar to roam, but just not pleasing to use. It was clunky, had strange windowing behaviors, and looked terrible.
Craft
I loved the look of Craft. The challenge I had is that Craft was meant for writing first, and PKM was a sort of “on your own” approach. Backlinks sort of worked, but the lack of filtering and query made it way less useful. There was now easy way to “look” into your data.
Where have I landed?
My current solution is going back to a tool called Notion. Notion is a pretty flexible environment to let you build your own writing environments and include structured data as part of that experience. It is 100% a grow your own solution out there, but that is also what makes it great. The last time I had used Notion I ended up leaving it because it felt too “fiddly”.
Now that I had a purpose for using it in a very specific way, the fiddly is the thing that helped solve my problem.
I have been able to build out my own Knowledge Library for things I am trying to remember, or reference in later discussions. This uses the databases inside of Notion. It also allows me to write unique queries through filtering, and choose different display outputs. This really does help me get to the key nuggets I care about quickly.
My Knowledge Library
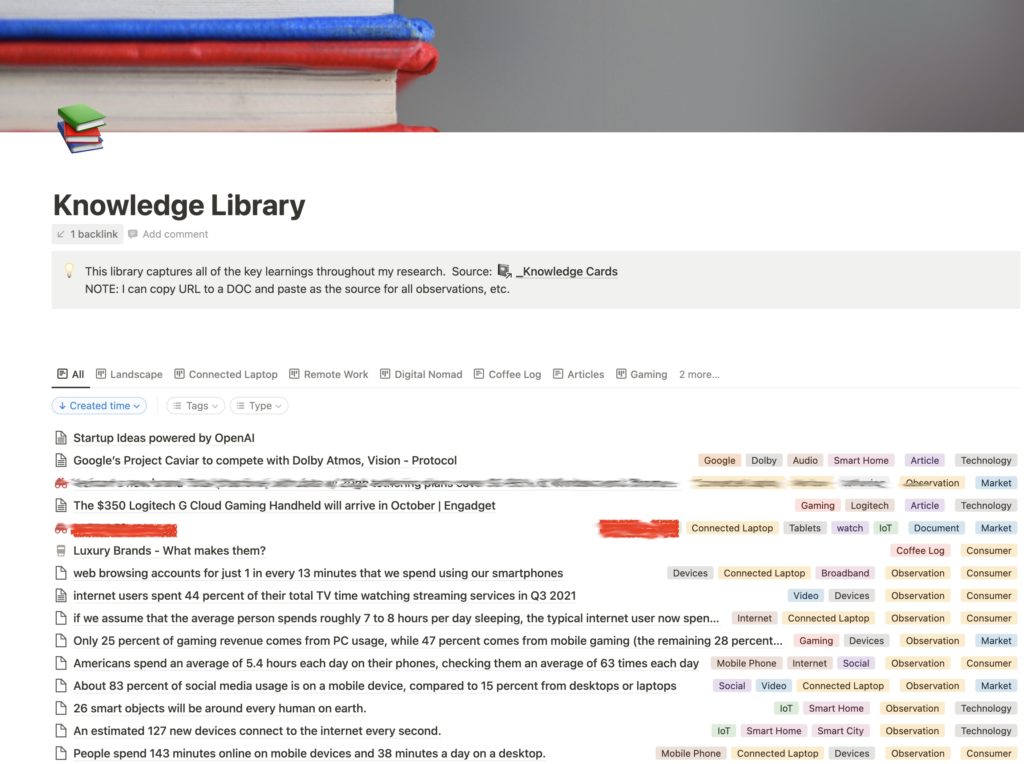
Below is a screenshot of my knowledge library. I have blocked out one line that is more personal in nature, but the rest are great examples of the types of snippets that get stored here.

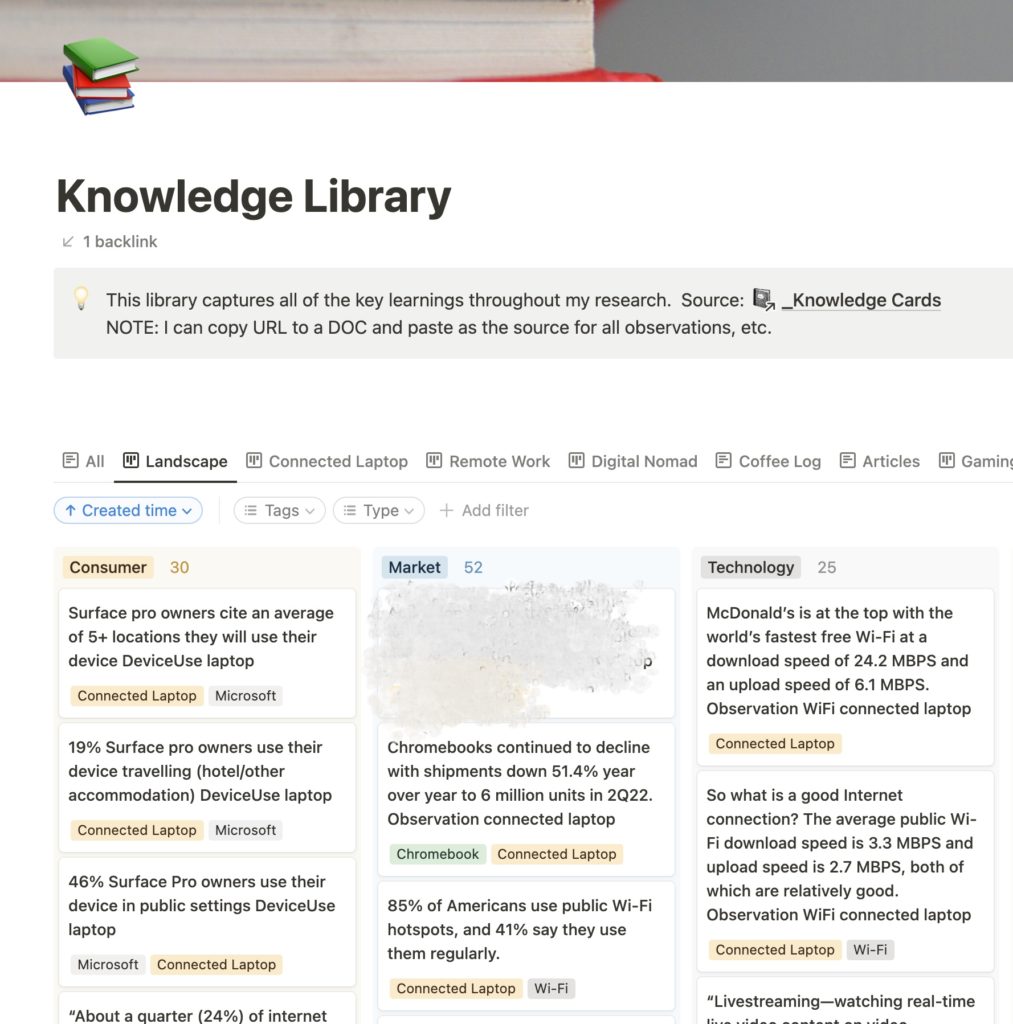
The reason this is becomes more useful for me is the way I can handle structured data vs the words in the other tools. I can attach tags, search by dates, create my own properties, etc. This makes it valuable. Let’s say that I want to just look across the landscapes I care about. I have a select item called LANDSCAPE. That can be Customer, Market, or Technology. Now I can just sort of those by going to my Landscape tab. (I created this tab through a filter of the database in a specific view)
Notice the new filtered view below:

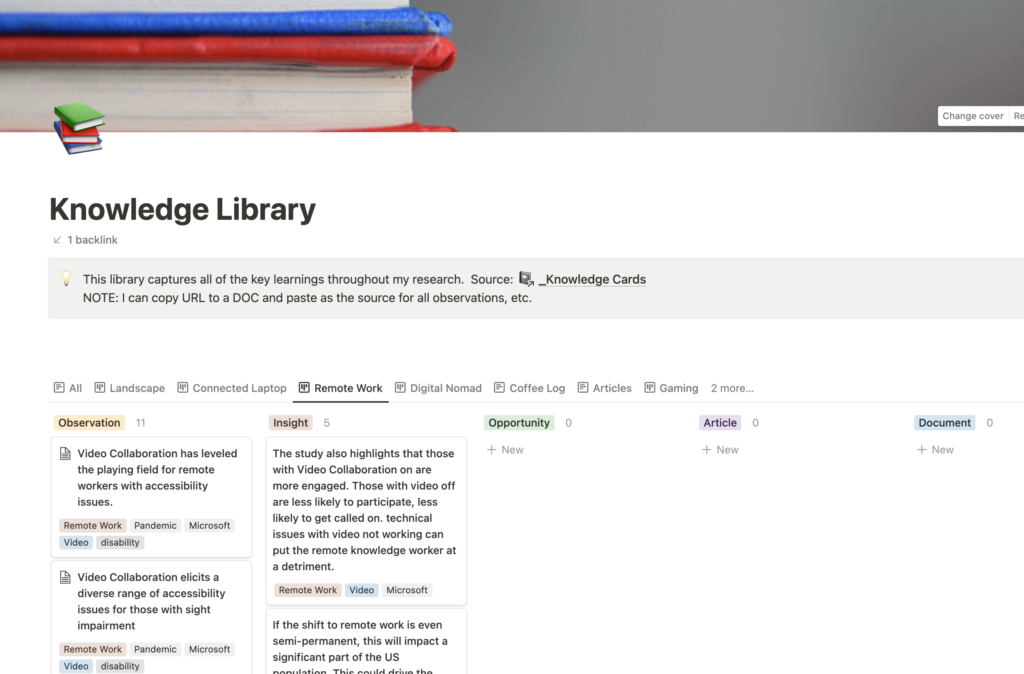
I can also create these filters to not just look across all of my library, but I can filter by tags too. When I add in new entries in the library I try to add tags for topics that make sense. For instance, if I wanted to see a pivot of this data with only things related to the topic of Remote Work, I could do that. I created myself a tab to show only those items.

You can see that this filtered view breaks down Remote Work into Observations, my insights, and any potential opportunities. I also have a place to link articles and documents related to this topic. This one is a bit sparse as it is not active for me, but I just wanted to show that even ad-hoc collecting interesting data over time might have value. (which is what I am trying to do: build a strong knowledge base to make decisions)